Funktionalisieren von Messdaten
> restart; with(plots):
opts:= 'font = [Courier, 12],
labels = [x, y],
size = [400, 300]':
labels = [x, y],
size = [400, 300]':
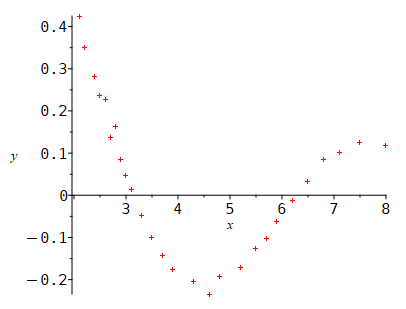
Messdaten:
> P[ 1]:= [2.1, .425]:
P[ 2]:= [2.2, .351]:
P[ 3]:= [2.4, .281]:
P[ 4]:= [2.5, .237]:
P[ 5]:= [2.6, .228]:
P[ 6]:= [2.7, .137]:
P[ 7]:= [2.8, .163]:
P[ 8]:= [2.9, .084]:
P[ 9]:= [3.0, .047]:
P[10]:= [3.1, .013]:
P[11]:= [3.3, -.048]:
P[12]:= [3.5, -.099]:
P[13]:= [3.7, -.142]:
P[14]:= [3.9, -.176]:
P[15]:= [4.3, -.205]:
P[16]:= [4.6, -.234]:
P[17]:= [4.8, -.192]:
P[18]:= [5.2, -.170]:
P[19]:= [5.5, -.126]:
P[20]:= [5.7, -.103]:
P[21]:= [5.9, -.063]:
P[22]:= [6.2, -.013]:
P[23]:= [6.5, .033]:
P[24]:= [6.8, .085]:
P[25]:= [7.1, .102]:
P[26]:= [7.5, .125]:
P[27]:= [8.0, .118]:
> plot({seq(P[i], i = 1..27)}, x = 2..8,
style = point,
symbol = cross,
color = red,
opts);
symbol = cross,
color = red,
opts);

Die Abhängigkeit der Messgröße y von x soll mit Hilfe einer ganz-rationalen Funktion g beschrieben werden:
> g:= x -> sum(a[i]*x^i, i = 0..n);
![]()
Auswahl der Stützpunkte:
> M:= [1, 5, 10, 15, 20, 23, 25, 27];
n:= nops(M) - 1;
MP:= [seq([P[M[j]][1], P[M[j]][2]], j = 1..n+1)]:
MP:= [seq([P[M[j]][1], P[M[j]][2]], j = 1..n+1)]:
![]()
![]()
Die Punkte P(M[j][1]| M[j][2]) sollen auf dem Schaubild von g liegen:
> lgn:= solve({seq(g(MP[k+1][1])= MP[k+1][2], k= 0..n)},
{a[k]$k = 0..n}):
assign(lgn):
for l from 0 to n do a[l]:= evalf(a[l], 5): od:
sort(g(x));
assign(lgn):
for l from 0 to n do a[l]:= evalf(a[l], 5): od:
sort(g(x));

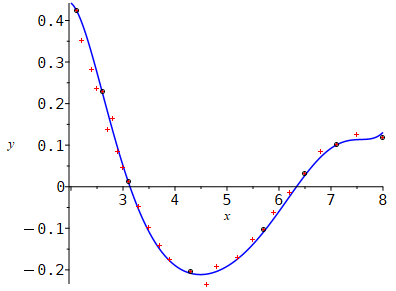
Zeichnen des Schaubildes von g (blau);
Markieren der Stützpunkte durch schwarze Kreise;
Löschen der Werte der Koeffizienten aj:
> Schaubild:= plot(g(x), x = 2..8,
color = blue,
opts):
color = blue,
opts):
Messpunkte:= plot({seq(P[i], i = 1..27)},
style = point,
symbol = cross,
color = red,
labels = [x, y]):
Stuetzpunkte:= plot(MP,
style = point,
symbol = circle,
color = black):
display([Schaubild, Messpunkte, Stuetzpunkte]);
style = point,
symbol = cross,
color = red,
labels = [x, y]):
Stuetzpunkte:= plot(MP,
style = point,
symbol = circle,
color = black):
display([Schaubild, Messpunkte, Stuetzpunkte]);

