Rechnen mit komplexen Zahlen
> restart;
Die imaginäre Einheit i als Lösung der Gleichung x2 = −1:
> eval(sqrt(-1));
![]()
Definition einer komplexen Zahl z:
> z:= x + y*I;
![]()
end:
cc(3+2*I);
cc(z);
cc(I);
![]()
![]()
![]()
Der Betrag einer komplexen Zahl:
![]()
![]()
![]()
![]()
Multiplikation von z1 und z2:
realteil:= evalc(Re(prod));
imaginärteil:= evalc(Im(prod));
![]()
![]()
![]()
![]()
Division zweier komplexer Zahlen:
![quot := (x[1]+y[1]*I)/(x[2]+y[2]*I)](images-komplzhl/komplzhl17.gif)

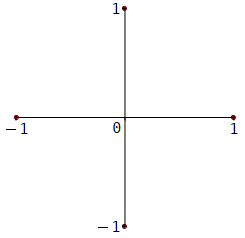
Die Darstellung komplexer Zahlen in der Gauß’schen Ebene:
symbol = solidcircle,
symbolsize = 16,
scaling = constrained,
tickmarks = [3, 3],
size = [250, 250],
axesfont = [Courier, normal, 12]);

Alle komplexen Zahlen z mit der Eigenschaft |z| = 1:
lgn:= solve(gl, y);
f1:= lgn[1]; unapply(f1, x):
f2:= lgn[2]; unapply(f2, x):
plot([f1(x), f2(x)], x = -1..1, y = -1..1,
labels = ["", ""],
scaling = constrained,
color = [red, blue],
tickmarks = [3, 3],
size = [250, 250],
axesfont = [Courier, normal, 12]);
![]()
![]()
![]()
![]()
![]()

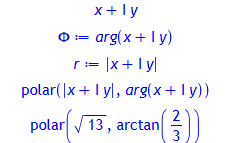
Komplexe Zahlen in Polardarstellung:
r:= abs(z);
convert(z, polar);
convert(3+2*I, polar);

Rechnen mit komplexen Zahlen in Polardarstellung:
simplify(polar(s,phi)^3);

exp, angewandt auf eine komplexe Zahl a + bi:
> evalc(exp(a + I*b));
![]()
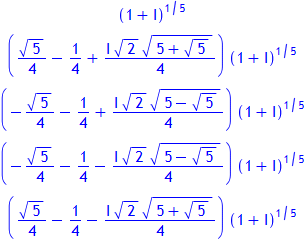
Lösungen der Gleichung z5 = 1 + i:
for i from 1 to nops(lgn) do
lgn[i];
od;

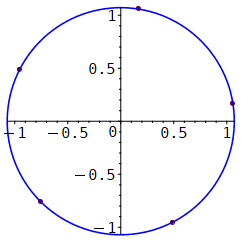
Darstellung dieser Lösungen im Argand-Diagramm:
font = [Courier, 12]
style = point,
symbol = solidcircle,
symbolsize = 16):
kreis:= plot (abs(lgn[1]),
coords = polar,
color = blue):
display (pkte, kreis,
scaling = constrained,
size = [250, 250]);

