Funktionen von zwei Veränderlichen
> restart;
Beispiel 1:
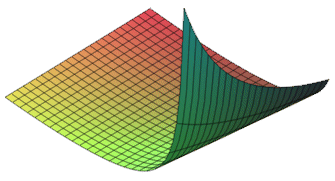
> z:= x*(x^2 + y^2)/(x-y);
plot3d(z, x = 2..5, y = 1.7..1.9,
style = polygonoutline,
size = [450, 450],
orientation = [129, 58],
axes = none);
plot3d(z, x = 2..5, y = 1.7..1.9,
style = polygonoutline,
size = [450, 450],
orientation = [129, 58],
axes = none);


Beispiel 2:
> z:= sin(x) + sin(y);
plot3d(z, x = -1.5*Pi..1.5*Pi,
font = [Courier, 10],
labelfont = [Courier, 12],
size = [450, 450],
orientation = [129, 58],
axes = boxed);
plot3d(z, x = -1.5*Pi..1.5*Pi,
font = [Courier, 10],
labelfont = [Courier, 12],
size = [450, 450],
orientation = [129, 58],
axes = boxed);
![]()
![[Maple Plot]](images-fkten2vl/fkten2vl4.gif)
Beispiel 3:
> with(plots):
Warning, the name changecoords has been redefined
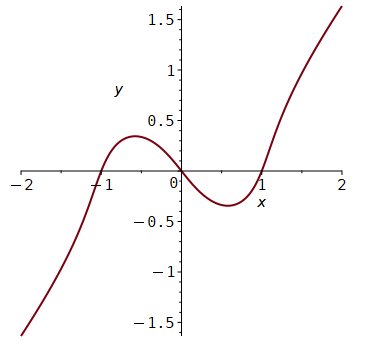
> f(x,y):= x^3 - y^3;
![]()
> implicitplot(f(x,y)= x + y,
x = -2..2,
y = -3..3,
numpoints = 2000,
font = [COURIER, 12],
labelfont = [Courier, 12],
size = [350, 350],
thickness = 2);
y = -3..3,
numpoints = 2000,
font = [COURIER, 12],
labelfont = [Courier, 12],
size = [350, 350],
thickness = 2);

Beispiel 4:
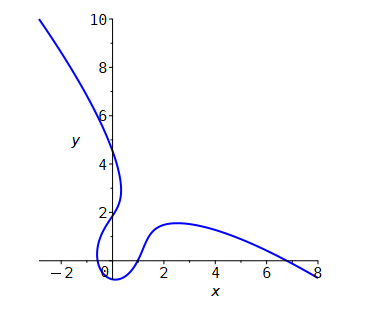
> gl:= sqrt(a*x^2 + b*y^2) = exp(k*(x + y)): gl;
![]()
> gl1:= subs({a = 2, b = 1, k = 1/3}, gl):
implicitplot(gl1, x = -4..8, y = -10..10,
thickness = 2,
font = [COURIER, 12],
labelfont = [Courier, 12],
size = [300, 300],
color = blue);
thickness = 2,
font = [COURIER, 12],
labelfont = [Courier, 12],
size = [300, 300],
color = blue);

> Bildfolge:= [ ]:
for k from 0.23 to 0.35 by 0.005 do
Bild:= implicitplot(subs({a = 2, b = 1}, gl),
x = -4..4,
y = -1..10,
thickness = 2,
color = red,
axesfont = [COURIER, 12],
labels = ["", ""],
numpoints = 500):
Bildfolge:= [op(Bildfolge), Bild]:
od:
display(Bildfolge, insequence = true, size = [350, 350]);
Bild:= implicitplot(subs({a = 2, b = 1}, gl),
x = -4..4,
y = -1..10,
thickness = 2,
color = red,
axesfont = [COURIER, 12],
labels = ["", ""],
numpoints = 500):
Bildfolge:= [op(Bildfolge), Bild]:
od:
display(Bildfolge, insequence = true, size = [350, 350]);
![[Maple Plot]](images/fktn2vl9.gif)
